

On-chain data shows Chainlink (LINK) has seen a month of consistent outflows, something that could prove to be bullish for the altcoin’s price.
Chainlink Exchange Netflow Has Been Negative Recently
In a new post on X, the market intelligence platform IntoTheBlock has discussed about the trend in the Exchange Netflow for Chainlink. The “Exchange Netflow” refers to an on-chain metric that keeps track of the net amount of LINK moving into or out of the wallets associated with centralized exchanges.
When the indicator has a positive value, it means the investors are depositing a net number of tokens of the asset into these platforms. As one of the main reasons why holders would transfer their coins to exchanges is for selling-related purposes, this kind of trend can have a bearish implication for the asset’s price.
On the other hand, the metric being under the zero mark suggests the exchange outflows are outweighing the inflows. Generally, investors take their coins away from the custody of these central entities when they want to hold into the long term, so such a trend can have a bullish impact on the cryptocurrency.
Now, here is the chart shared by the analytics firm that shows the trend in the Chainlink Exchange Netflow over the past month:

The value of the metric seems to have been negative recently | Source: IntoTheBlock on X
As displayed in the above graph, the Chainlink Exchange Netflow has been inside the negative region for almost all of the past month, implying the investors have constantly been making net withdrawals.
In total, the exchanges have registered net outflows amounting to $120 million in this period. Given this trend, it’s possible that the investors have been in a phase of accumulation.
During the last few days, LINK has enjoyed some recovery in its price, which could potentially be an effect of this buying activity. The Exchange Netflow could now be to monitor in the coming days, as where it heads next could also have an influence on the coin.
Naturally, the outflow streak keeping up would be a bullish sign for Chainlink, while the indicator witnessing a reversal into the positive region could mean a bearish end for the recovery run.
Speaking of the price recovery, on-chain data could hint at where the next major resistance wall could lie for LINK, as analyst Ali Martinez has explained in an X post.
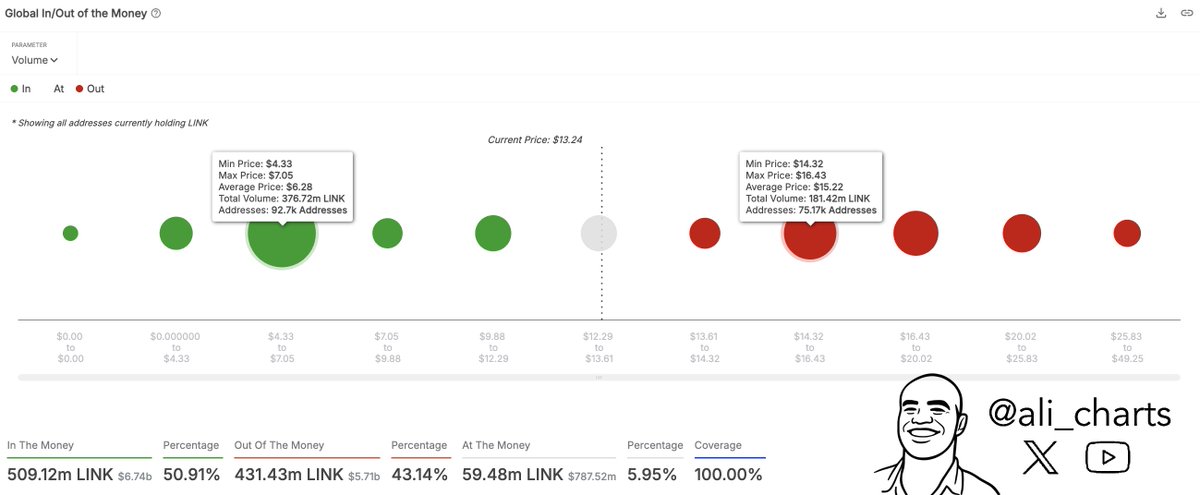
The cost basis distribution of the LINK supply across the different price ranges | Source: @ali_charts on X
From the above chart, it’s visible that the Chainlink investors last purchased a total of 181.42 million LINK inside the $14.32 to $16.43 range. These investors, who are currently underwater, may provide impedance to the price if a retest occurs, as they could be desperate to exit at their break-even.
LINK Price
At the time of writing, Chainlink is trading around $13.74, up over 10% in the last seven days.
The trend in the LINK price during the last five days | Source: LINKUSDT on TradingView
Featured image from Dall-E, IntoTheBlock.com, chart from TradingView.com
Editorial Process for bitcoinist is centered on delivering thoroughly researched, accurate, and unbiased content. We uphold strict sourcing standards, and each page undergoes diligent review by our team of top technology experts and seasoned editors. This process ensures the integrity, relevance, and value of our content for our readers.


Leave a Comment