
Reason to trust
![]()
Strict editorial policy that focuses on accuracy, relevance, and impartiality
Created by industry experts and meticulously reviewed
The highest standards in reporting and publishing
Strict editorial policy that focuses on accuracy, relevance, and impartiality
Morbi pretium leo et nisl aliquam mollis. Quisque arcu lorem, ultricies quis pellentesque nec, ullamcorper eu odio.
The Ethereum price action is raising red flags among analysts, with technical indicators pointing toward a potential crash to the $2,000 level. Despite experiencing a significant uptick recently following Bitcoin’s price surge, concerns continue to grow that a deeper correction may be unfolding.
Ethereum Price Crash To $2,000 Imminent
Based on a new report by Master Ananda, a TradingView crypto analyst, the Ethereum market is flashing warning signs as its price struggles below the critical resistance zone. At press time, Ethereum is trading at approximately $2,605 after being rejected from a local high of around $2,788.
Related Reading
Ethereum’s 4-hour chart presented by Master Ananda shows that the top altcoin has likely completed a short-term top, and now a corrective move is in play. The analysis hints at a looming price crash, with technical forecasts suggesting a retracement toward the $2,000 level or lower before the next bullish impulse.
The analyst’s bearish continuation thesis appears to be a high-probability setup, with Ethereum expected to revisit lower Fibonacci retracement levels. Notably, the chart reveals a subtle bearish divergence forming as the price pushed slightly higher in May but with diminishing momentum. This, in turn, created a rising resistance line while volume and price action failed to confirm new highs.
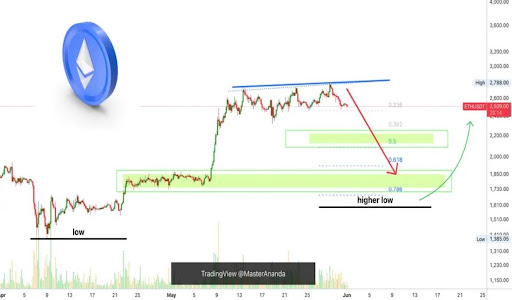
Noticeably, Ethereum’s price has since broken below the 0.230 Fibonacci level, signaling the possible start of a broader correction phase. The next probable support areas lie at $2,280 (0.382 Fib), $2,085 (0.5 Fib), and most significantly, the $1,900 price point at the 0.618 Fib Retracement level.
The highlighted green zones in Master Ananda’s chart represent potential support and buying areas, which point to the $1,900 to $1,735 (0.618-0.786 Fib) range as the most likely zone for a higher low to form. The previous major low occurred on April 7, and the expectation is that this correction will end above that level. Until then, a short-term correction remains the most likely scenario, and traders are warned to take caution as the chart further highlights a possibly more resounding crash to $1,385.
ETH Trade Strategy: Buy The Dip And Go Long
While sharing his bearish thesis for Ethereum, Master Ananda also provided a clear strategy for investors and traders. He advised long-term holders to wait patiently for the projected drop and assess the support reaction before looking for clear reversal signals.
Related Reading
Buying into support zones like $1,900 or even as low as $1,736 could provide optimal entry points for long-term positions. While bears may still attempt to short the market, Master Ananda assures that the downside remains limited.
The analyst emphasizes the importance of planning and avoiding impulsive trading by creating ideal entry and exit points while respecting the prevailing market trend. With Ethereum’s bullish outlook still intact, this projected price crash could become an opportunity for many traders instead of a threat.
Featured image from Getty Images, chart from Tradingview.com


Leave a Comment