
Ethereum price crashed for two consecutive weeks and retested a crucial support level as exchange-traded fund outflows jumped.
Summary
- Ethereum’s two-week slide has brought the token back to a key $4,000 support level, pressured by waning institutional demand and record ETF redemptions.
- U.S.-listed ETH funds shed nearly $800 million in assets this week—their largest outflow to date—erasing the strong inflows of early September.
- With $26 billion still parked in Ethereum ETFs, representing 5.37% of total supply, the pullback underscores how quickly institutional sentiment toward the world’s second-largest cryptocurrency can shift.
Ethereum price falls as ETH ETF outflows rise
Ethereum (ETH) was trading at the important support level at $4,000, down from the year-to-date high of $4,920. It remains up by 190% above the April low of $1,377.
ETH price pulled back this week as demand from American institutional investors slowed and liquidations rose.
Data shows that ETH ETFs suffered a record $795 million outflow this week. The previous weekly record was in the first week of September, when they shed over $787 million in assets.
Ethereum funds experienced inflows of $556 million last week and $637 million the week before. That is a sign that the growth momentum among American institutions is falling.
These funds now have $26 billion in assets, which is equivalent to 5.37% of the total supply.
ETH price also slipped after suffering a whopping $1.5 billion in liquidations during the week. These liquidations happened as exchanges like Binance and OKX closed leveraged bullish trades as the price crashed. Historically, an asset drops when there are a big increase in liquidations.
Macro factors also contributed to the Ethereum price crash. For example, there are concerns on whether the Federal Reserve will continue cutting interest rates in the coming weeks amid persistent inflation. A report released this week showed that the personal consumption expenditure moved further away from the Fed target of 2.0%.
ETH price technical analysis
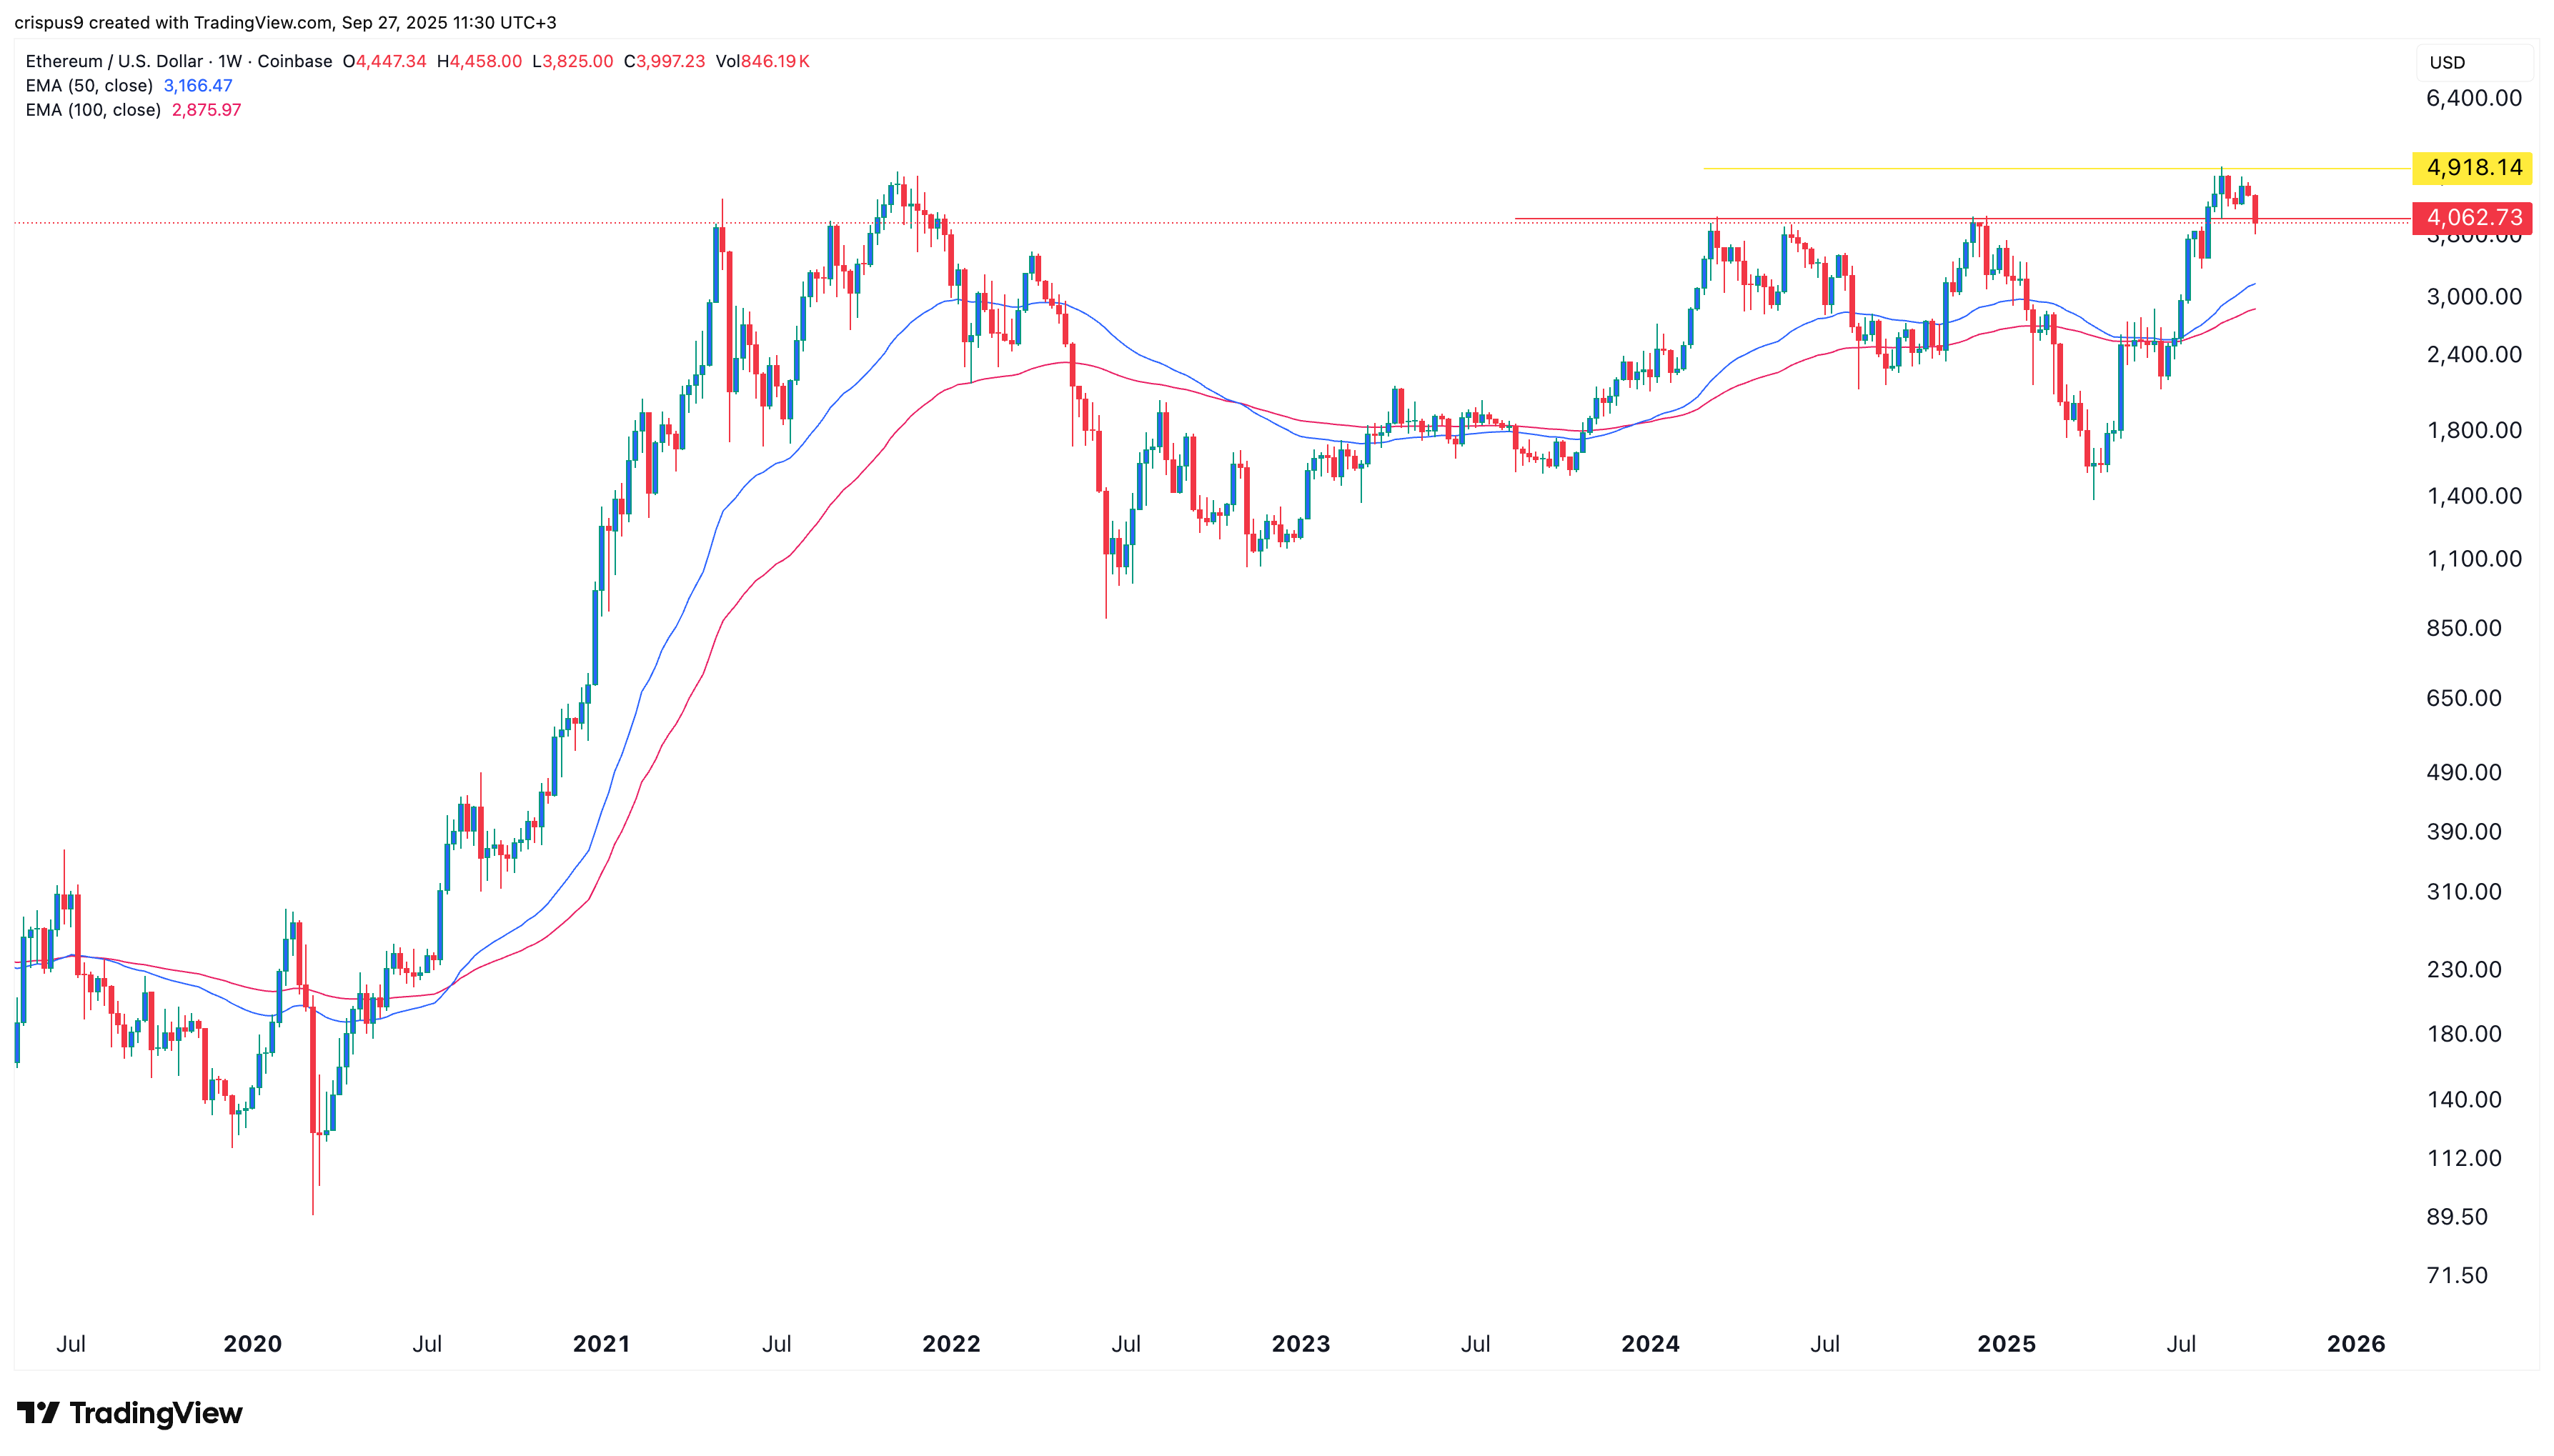
The weekly chart shows that the ETH price pulled back from the year-to-date high of $4,918 to a low of $3,825 this week.
On the positive side, the coin has formed a break-and-retest pattern since the current level is along the highest point in March, May, and November last year. A break-and-retest is a common continuation sign.
The coin has also remained above the 50-week and 100-week Exponential Moving Averages. Therefore, the outlook is bullish as long as it remains above the support at $4,000. If this happens, the coin will likely retest the all-time high and move towards $5,000.


Leave a Comment