
Reason to trust
![]()
Strict editorial policy that focuses on accuracy, relevance, and impartiality
Created by industry experts and meticulously reviewed
The highest standards in reporting and publishing
Strict editorial policy that focuses on accuracy, relevance, and impartiality
Morbi pretium leo et nisl aliquam mollis. Quisque arcu lorem, ultricies quis pellentesque nec, ullamcorper eu odio.
Este artículo también está disponible en español.
Ethereum price started a recovery wave from the $1,750 zone. ETH is now consolidating and facing hurdles near the $1,920 resistance.
- Ethereum started a recovery wave above the $1,850 level.
- The price is trading below $1,950 and the 100-hourly Simple Moving Average.
- There is a short-term bearish trend line forming with resistance at $1,920 on the hourly chart of ETH/USD (data feed via Kraken).
- The pair must clear the $1,920 and $1,950 resistance levels to start a decent increase.
Ethereum Price Faces Hurdles
Ethereum price formed a base above the $1,750 level and started a recovery wave, like Bitcoin. ETH was able to clear the $1,800 and $1,820 resistance levels.
The bulls pushed the price above the $1,880 level. There was a move above the 23.6% Fib retracement level of the downward wave from the $2,150 swing high to the $1,752 low. However, the bears seem to be active near the $1,920 resistance zone.
Ethereum price is now trading below $1,950 and the 100-hourly Simple Moving Average. On the upside, the price seems to be facing hurdles near the $1,920 level.
There is also a short-term bearish trend line forming with resistance at $1,920 on the hourly chart of ETH/USD. The next key resistance is near the $1,950 level or the 50% Fib retracement level of the downward wave from the $2,150 swing high to the $1,752 low.
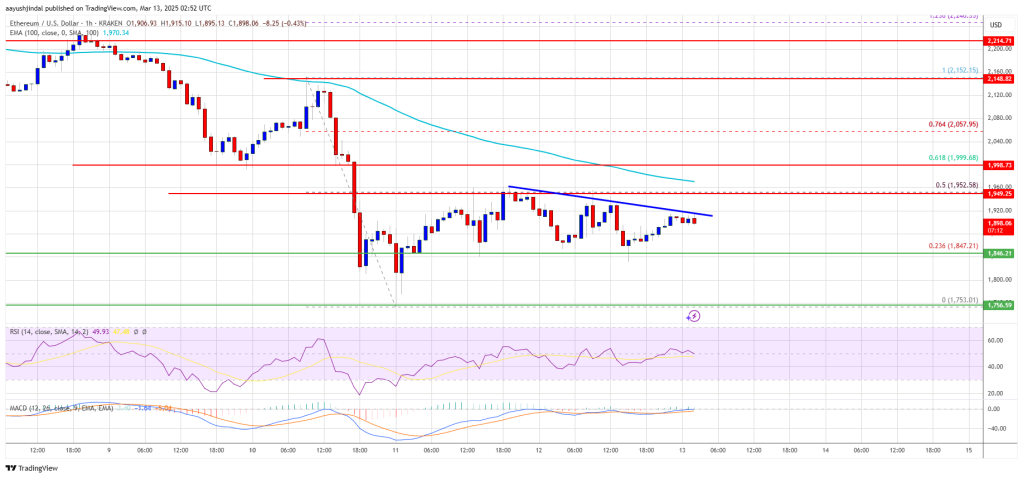
The first major resistance is near the $2,000 level. A clear move above the $2,000 resistance might send the price toward the $2,060 resistance. An upside break above the $2,060 resistance might call for more gains in the coming sessions. In the stated case, Ether could rise toward the $2,120 resistance zone or even $2,250 in the near term.
Another Decline In ETH?
If Ethereum fails to clear the $1,920 resistance, it could start another decline. Initial support on the downside is near the $1,850 level. The first major support sits near the $1,800 zone.
A clear move below the $1,800 support might push the price toward the $1,750 support. Any more losses might send the price toward the $1,720 support level in the near term. The next key support sits at $1,650.
Technical Indicators
Hourly MACD – The MACD for ETH/USD is losing momentum in the bearish zone.
Hourly RSI – The RSI for ETH/USD is now above the 50 zone.
Major Support Level – $1,800
Major Resistance Level – $1,920


Leave a Comment