
Reason to trust
![]()
Strict editorial policy that focuses on accuracy, relevance, and impartiality
Created by industry experts and meticulously reviewed
The highest standards in reporting and publishing
Strict editorial policy that focuses on accuracy, relevance, and impartiality
Morbi pretium leo et nisl aliquam mollis. Quisque arcu lorem, ultricies quis pellentesque nec, ullamcorper eu odio.
XRP spent the past forty-eight hours coiling into a textbook inflection zone, and the 15-minute chart published by independent analyst Casi makes it hard to miss where the battle lines now stand. Price is hovering at $2.18, clinging to a steeply rising trendline that has underpinned every impulsive thrust since the local swing low near the 0.618 retracement at $1.9824 on 23 June. That trendline intersects a horizontal shelf of former resistance-turned-support at the 1.618 extension measured from the same base move, labelled on the chart at $2.186. The confluence forms the geometric “apex of consolidation” Casi has been highlighting on X.
XRP Price At Breaking Point
“This trendline is everything right now,” Casi wrote. “We just got a clean reaction off it. This correction already reached the .382 retracement at $2.145, which also happens to be the apex of consolidation… that’s the most critical level on the chart, short-term.”
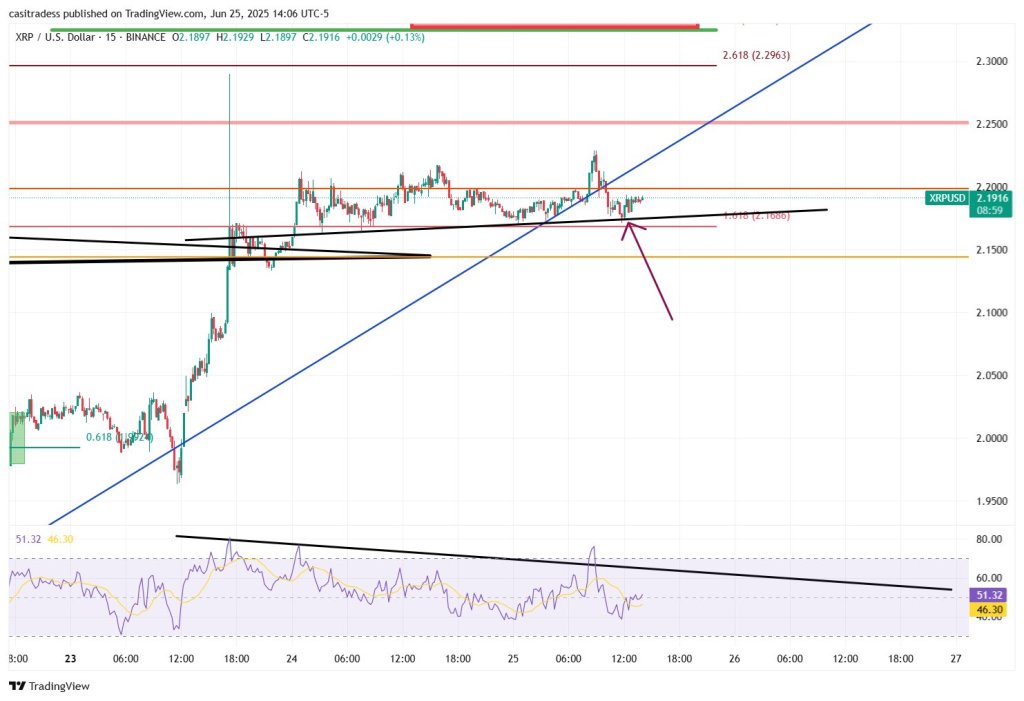
The most recent corrective pullback already tagged the 0.382 Fibonacci retracement of the advance, exactly at $2.145, before bulls forced a reaction. As long as candles continue to close above that retracement—effectively the floor of the micro-range—Casi argues that the underlying market structure remains constructive. A decisive break beneath $2.145, by contrast, would represent both a loss of the diagonal trendline and a surrender of the consolidation base, signalling short-term weakness and, in his words, “opening the door to a deeper flush.”
Related Reading
Overhead, XRP must still reckon with layered resistance. The first ceiling sits at $2.20, but the level called out as “the next big test” is the thicker pink band at $2.25. That mark capped price repeatedly during yesterday’s U.S. session and coincides with a prior 1.272 extension of the late-May corrective leg. “If we can flip that level, we’ll likely open the path toward the $2.69 retrace test,” Casi noted, “and from there, the breakout potential increases dramatically!”
If price can reclaim $2.25 on expanding volume and then retest it as support, the chart leaves an unobstructed lane toward the 2.618 extension at $2.296—effectively $2.30—and, by projection, the $2.69 Fibonacci target that would complete the measured-move roadmap Casi is tracking.
Related Reading
Momentum, however, is not yet offering a clean green light. The lower pane shows a 14-period RSI capped by its own descending trendline that has compressed every rally since 24 June. With the oscillator printing 46.24 (signal) versus 43.59 (base line) at the time of the screenshot, the gauge is climbing but still mid-range. A marginal higher high in price paired with a lower high in RSI would etch a textbook bearish divergence—an outcome Casi told one follower he is “expecting to set up” if XRP pierces $2.25 before consolidating anew. “I think this next high will form a bearish div,” he added. “The RSI is telling me it’s about to set that up.”
In short, the token is balanced on a knife-edge: the bull case hinges on the integrity of the $2.145–$2.186 support complex and a breakout through $2.25, while the bear case rests on trendline failure and an RSI divergence confirming upside exhaustion. With liquidity thinning into the weekend, the resolution of this narrow consolidation could shape the next wave—whether that proves to be the ignition of a larger third impulse or the start of a deeper corrective detour. As Casi put it, “This is the kind of price action you want to see if XRP is serious about continuing this new trend to the upside.”
At press time, XRP traded at $2.19.
Featured image created with DALL.E, chart from TradingView.com


Leave a Comment