
XRP price has rebounded by more than 40% from its lowest point last Friday. The rebound could accelerate after the formation of a rare candlestick pattern and as growth in the Ripple USD stablecoin continues.
Summary
- XRP price has formed a large hammer candlestick pattern on the three-day chart.
- The Ripple USD stablecoin total supply is nearing the $1 billion milestone.
- Ripple price will likely benefit from the potential XRP ETF approval.
Ripple (XRP) token jumped to a high of $2.5130 on Tuesday as most cryptocurrencies rebounded following last week’s plunge.
Ripple USD stablecoin is nearing a $1 billion milestone
One of the main catalysts for XRP is the ongoing growth of the Ripple USD (RLUSD) stablecoin. According to CoinMarketCap, the token’s market cap has jumped to $840 million from $53 million on January 1.
This growth makes it one of the fastest-growing stablecoins in the crypto industry. If the trend continues, the coin’s market capitalization will soon cross the $1 billion milestone.
Data compiled by Artemis show that RLUSD usage is accelerating. The number of holders rose by 15% in the last 30 days to about 5,000, while the number of transactions jumped by 46% to 457,000. As a result, adjusted transaction volume rose by 470% to $2.2 billion.
Still, the only challenge is that most of the RLUSD supply is on Ethereum (ETH), with only $91 million being in the XRP Ledger.
XRP price will also benefit from rising institutional demand among American investors. The recently launched XRPR ETF has already reached $90 million in assets, a trend that may continue as inflows increase.
This growth is a sign of investor interest in the token, which has an expense ratio of 0.75%. As such, other, cheaper XRP ETFs from companies such as Franklin Templeton and 21Shares will likely attract substantial inflows.
Another sign of XRP demand is the recently launched XRPFI product by Flare (FLR), which has attracted more than $60 million in assets three weeks after its launch. The XRPFI token enables users to use XRP in decentralized finance.
XRP price technical analysis
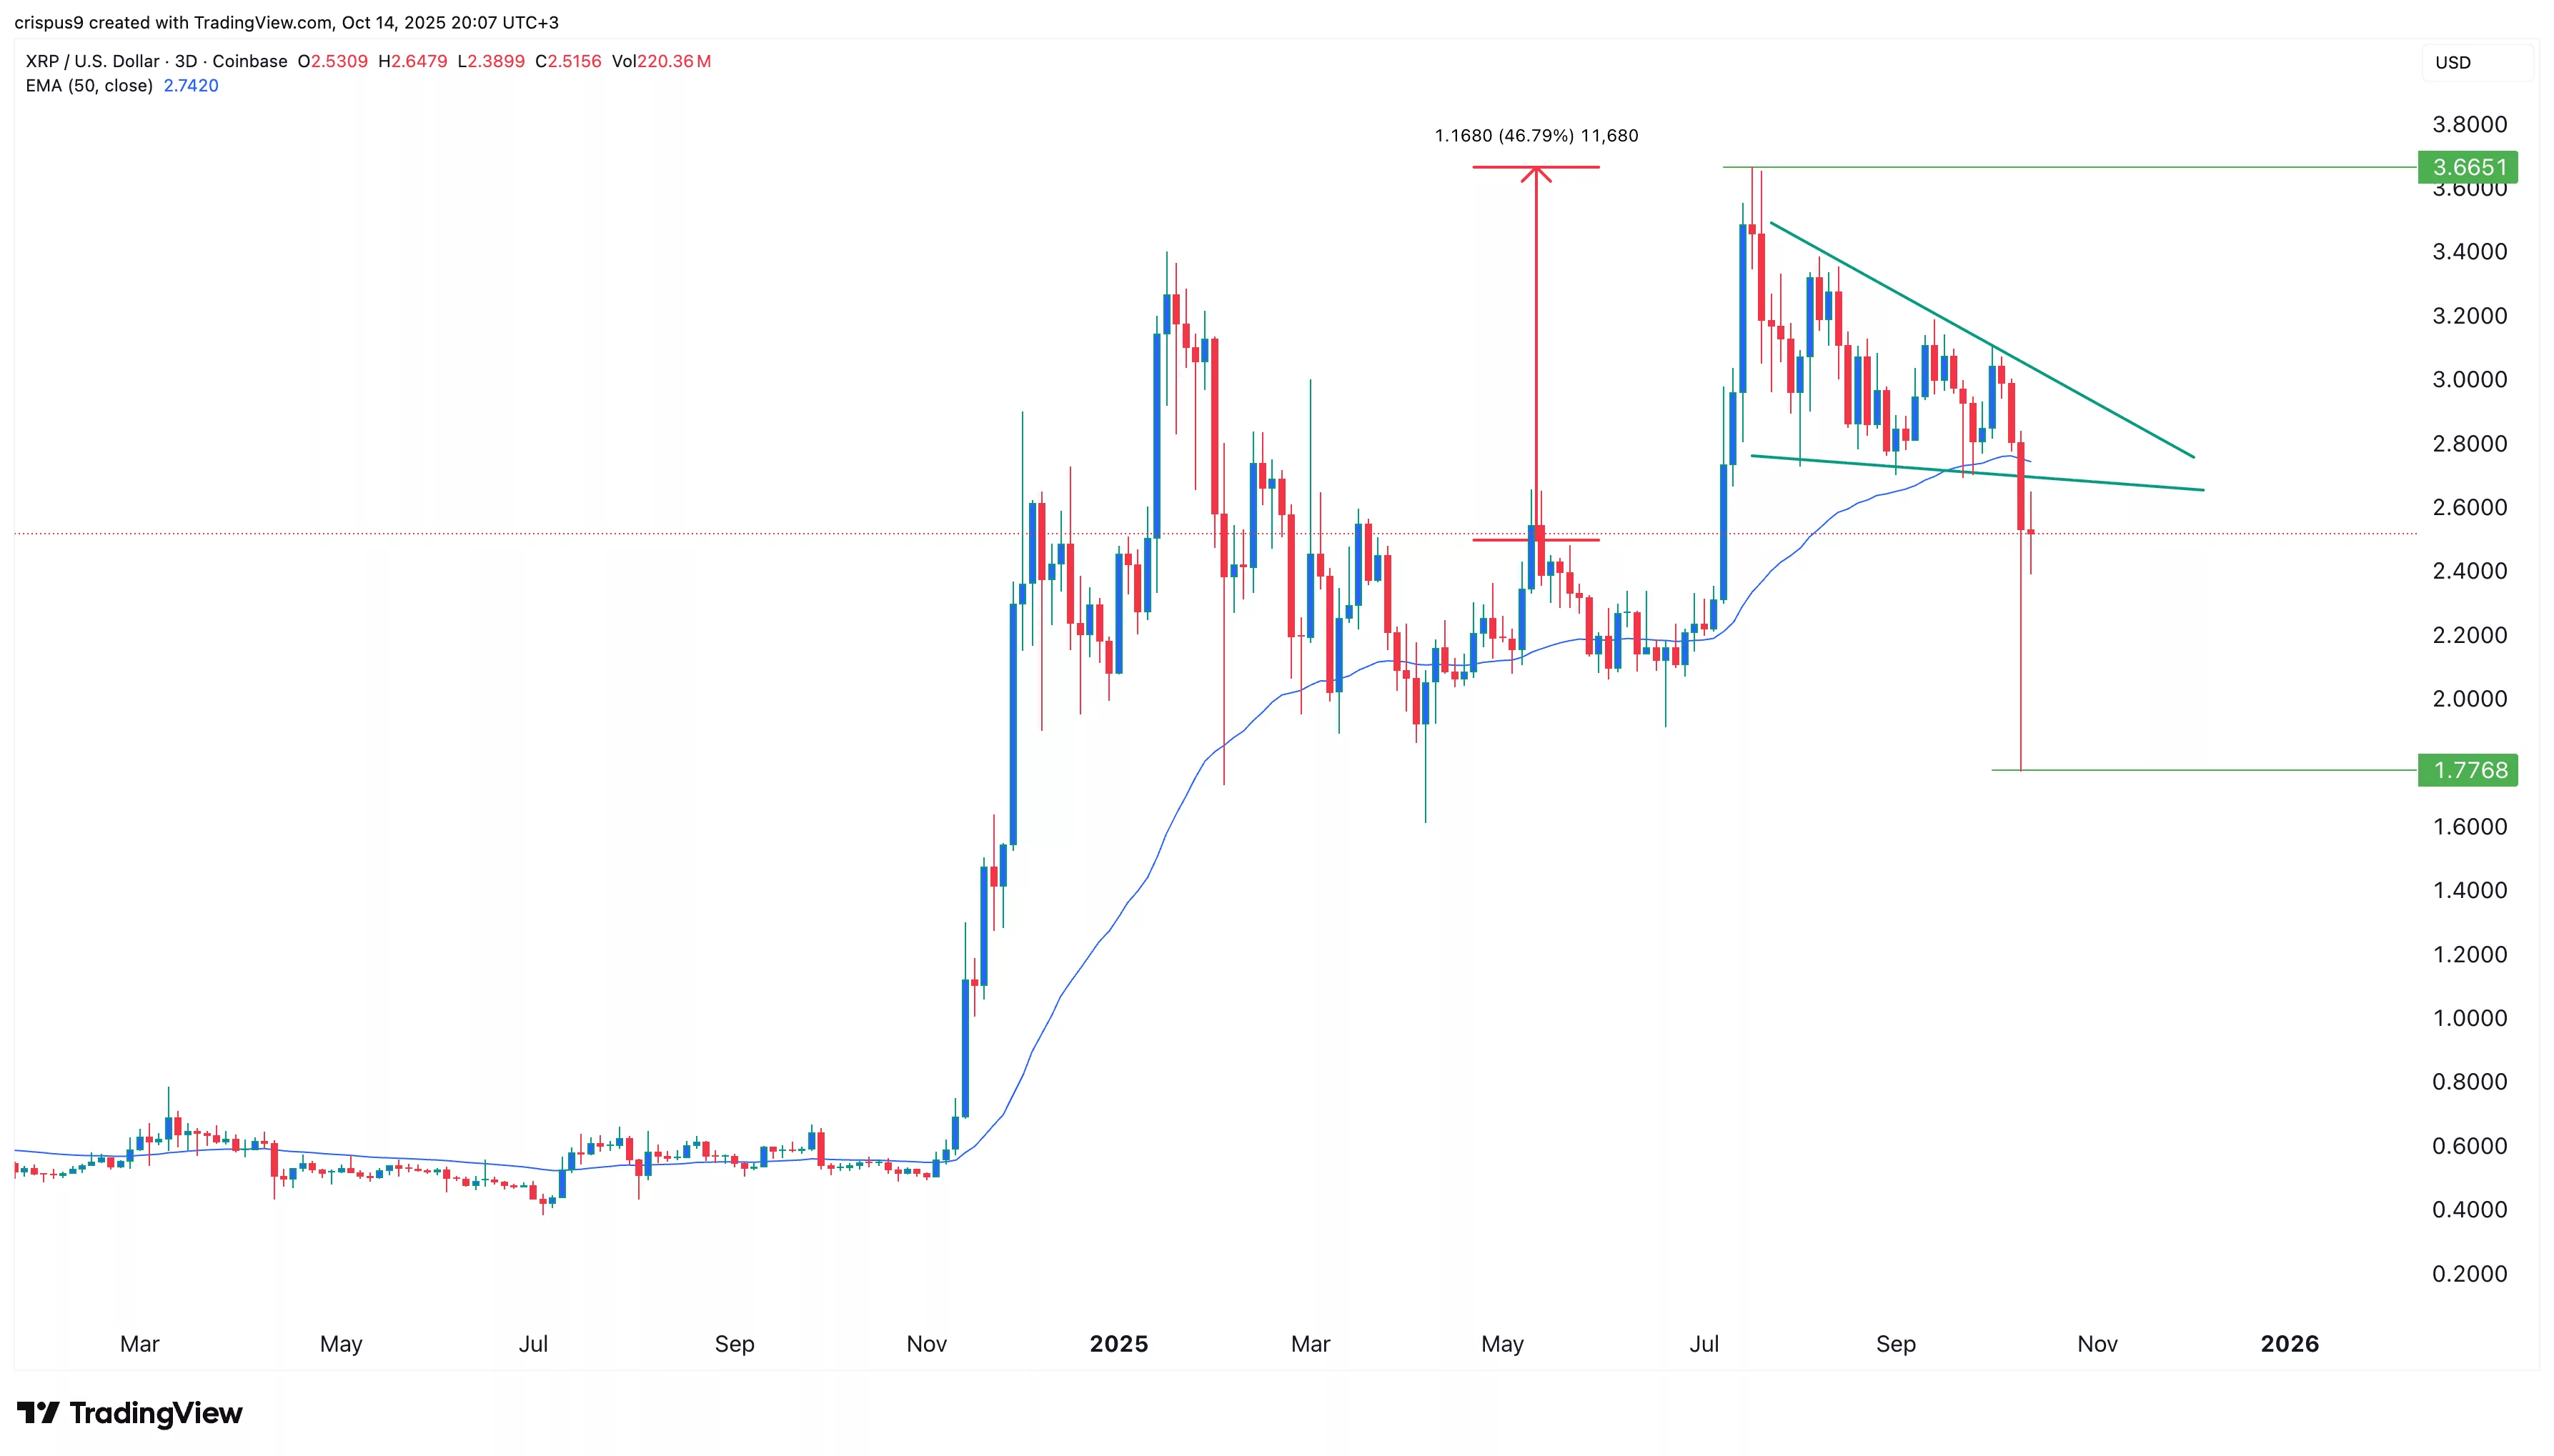
XRP price chart | Source: crypto.news
The three-day chart shows that the XRP price bottomed at $1.7768 as the crypto market crash happened on Friday last week. It moved to its lowest level since April 7 this year.
XRP price has now formed a large hammer candlestick pattern, which often leads to a strong bullish breakout. This pattern is made up of a long lower shadow that is often twice the size of the body. It has a small body and little or no upper shadow.
The pattern indicates that sellers drove the token much lower before buyers stepped in and pushed it higher. This pattern could also be a sign that the recent crash was a shakeout that could lead to more gains as weaker traders are forced out.
Therefore, further gains will likely push XRP much higher, potentially to the year-to-date high of $3.665, which is about 46% above the current level.


Leave a Comment